
Australia records more than 15,000 underground utility strikes a year, costing the economy $4.6 billion in project delays, service disruptions, asset damage and lost productivity, according to research from Before You Dig Australia. Before a machine turns a sod, the contractor lodges a BYDA enquiry and gets the plans back, and the pitch from a new crop of software is that a bundle of separate PDFs can be turned into a single map you can open on a tablet at the trench.
Trade publication Infrastructure Magazine put one of those tools, Undermaps by Reveal, under the spotlight in an article published in August. Worth flagging before anything else: the performance figures in that piece come from the company building the product and from one contractor using it. There’s no independent testing behind them, and BCN doesn’t test products.
What a BYDA enquiry actually hands you
Anyone who’s lodged one knows what comes back isn’t a map. It’s a stack.
“A single BYDA enquiry can return dozens of individual plans from different asset owners,” Reveal managing director Nick Hearn said. “Engineering teams are then required to manually review, compare and overlay each document before planning can properly progress.”
That’s the part nobody quotes in a tender. Infrastructure Magazine reports engineering teams may spend days or even weeks tracing utility alignments, aligning drawings and trying to build a coherent picture of what’s buried, and that on a large job the manual overlay can run to two weeks depending on size and complexity before design work properly begins.
On a job carrying water, sewer, gas, power, comms and a council asset owner, you’re comparing drawings produced at different scales, in different decades, to different conventions. Then someone has to hold that picture in their head at the machine.
The claims, and who is making them
Hearn says Undermaps uses artificial intelligence to automatically digitise, geo-reference and align every referral from a dial, and puts the saving at 15 times cheaper and 90 per cent faster than doing the same work by hand. Those are the vendor’s numbers, not a verified benchmark.
“Users simply upload their original BYDA .zip file to the Undermaps portal, where it is automatically processed into a format that project team members can view, understand and share,” Hearn said.
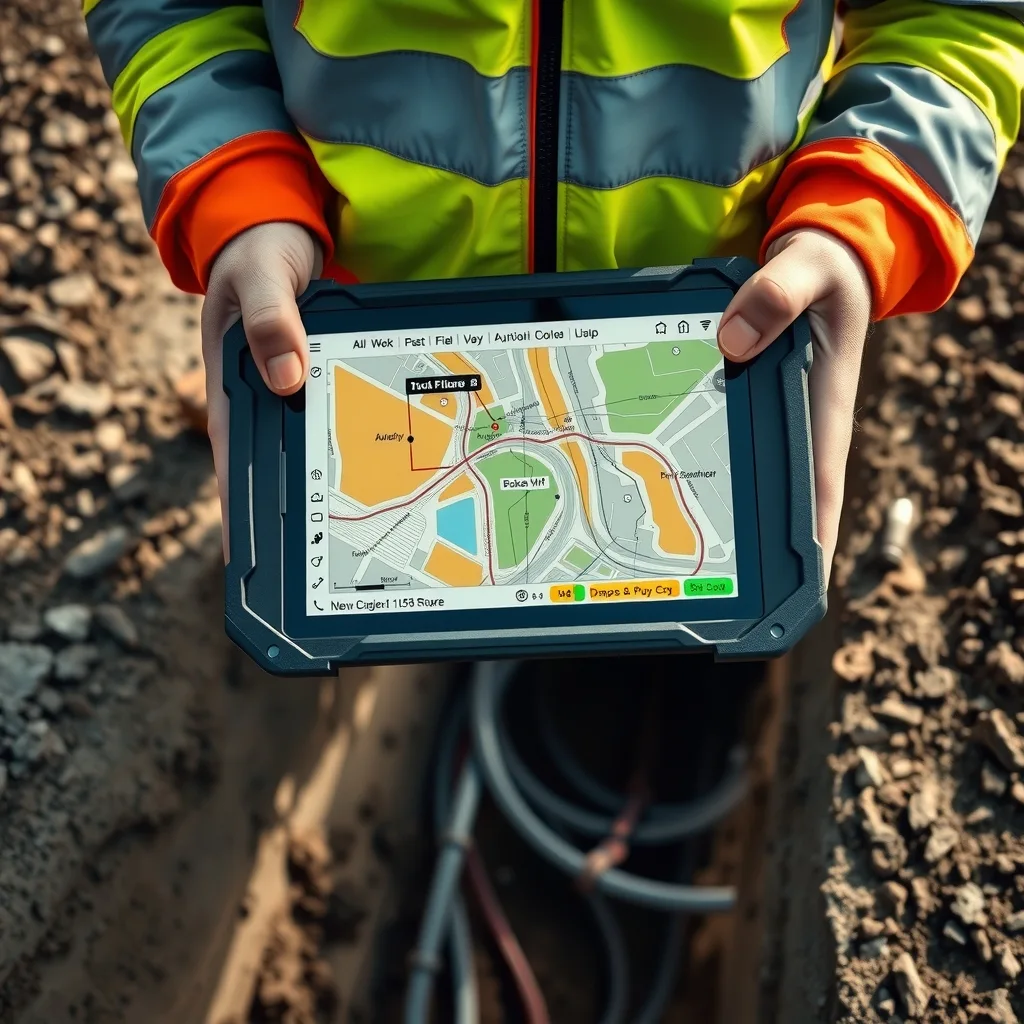
According to the article, the processing engine spits out a consolidated digital map colour-coded in accordance with AS 5488, the Australian standard for subsurface utility information, while keeping the original PDF metadata attached so a drawing can be traced back to its asset owner. The map can then be opened in the office or in the field on a range of devices.
Hearn is careful about where the tool sits in the chain. “BYDA remains the source of truth for underground utility data, but there comes a point where innovation is needed to substantially improve the workflow for everyone involved. That’s what Undermaps is designed to do.”
He also framed it as a data-sharing problem rather than a drafting one. “As the industry continues to embrace digital engineering and common data environments, we’re seeing growing demand for faster and more collaborative ways to convert static utility records into information that can be shared, searched and analysed,” he said.
One contractor, on the record
The article carries a single customer voice. Burton Contractors director Chris Burton said the platform changed how his crew handles the paperwork stage.
“We used Undermaps to overlay BYDA dials into a consolidated digital view in a fraction of the time it normally does. The improvement it has made to our workflow has been significant, and we’ll use it every time we can,” Burton said.
That’s one client quoted in a story about the product, so weigh it accordingly. The complaint underneath it, though, is one every civil outfit in the country will recognise.

What it means on the tools
The hours lost to plan overlay usually aren’t worn by the operator in the seat. They’re worn by the engineer, surveyor or drafter doing pre-construction work that doesn’t move a gram of dirt, and by the site supervisor waiting on a start date. Pull a chunk of that out of the front end and the dig window comes forward, which matters more to a small civil crew juggling two jobs than it does to a tier one with a planning department.
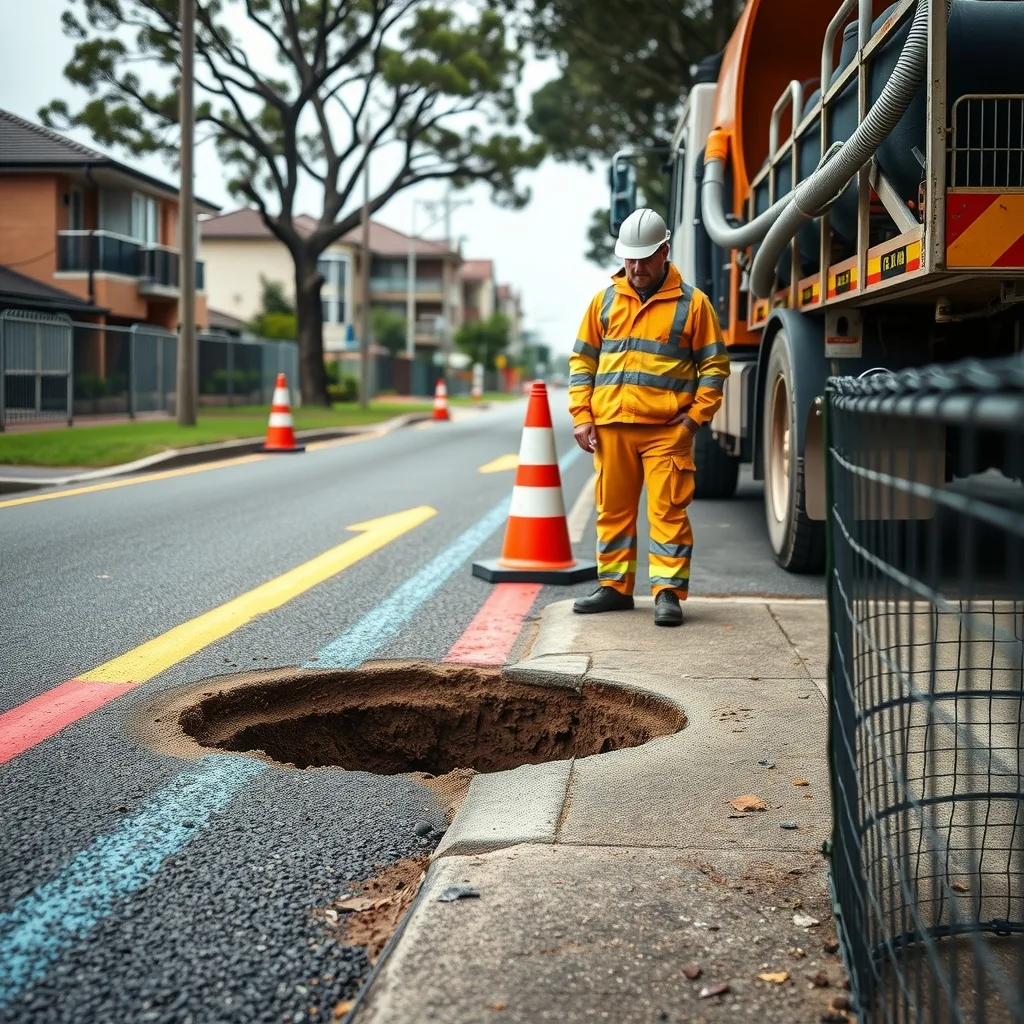
There’s another side to the ledger: the strike itself. Clip a live comms conduit or a gas service and the day stops. Crew standing around, the asset owner’s repair bill, an incident report, and a client who now wants to talk about programme. That’s what the $4.6 billion figure is made of, spread across 15,000 events a year.
One thing no software licence changes: a clearer map is still a map. How you confirm the physical position of a service, and how you work near it once you’ve found it, is set by the asset owner’s requirements and your state work health and safety regulator, not by a portal. Safe Work Australia and the state regulators remain the place to check that, and the article makes no claim otherwise, describing the platform as making existing information easier to interpret rather than replacing it.
What to watch
The automated processing feature is in an early-access pilot, with customers onboarded progressively off a waitlist through the rest of the year, according to the article. Details are at undermaps.com/ingest.
The bigger question for anyone running a civil crew is whether the asset owners themselves start issuing machine-readable data, which would take the digitising step out of the equation for everyone. Until then, if a vendor comes at you with a saving of 90 per cent, the sensible move is to hand them a dial from a job you’ve already overlaid by hand and see how the two maps compare.
Frequently asked questions
How much do underground utility strikes cost Australia each year?
Before You Dig Australia research cited by Infrastructure Magazine puts it at more than 15,000 strikes a year, costing $4.6 billion in delays, disruption, asset damage and lost productivity.
What does a BYDA enquiry actually give you?
It returns a stack of separate plans from each asset owner involved, which engineering teams then have to manually review, compare and overlay before planning can progress.
Are the 90 per cent faster and 15 times cheaper claims for Undermaps verified?
No. Those figures come from Reveal, the company that built the product, and one customer using it. There’s no independent testing behind them.
Does digital mapping software replace the need to confirm where a service actually is on site?
No. The article and BCN both note a clearer map is still a map, confirming the physical position of a service is governed by the asset owner’s requirements and state work health and safety regulators, not a software portal.
Sourced from Infrastructure Magazine, Before You Dig Australia. Original article.